数値微分は、Pythonによる数値解析や機械学習に欠かせない計算手法の1つです。
本記事では、そんなPython基礎となる数値微分について、詳しくご説明します。
- Python初心者の人
- Pythonでの微分計算方法について学びたい人
数値微分
数値微分とは、ある関数の各点における変化の割合(傾き)のことです。
例えば、加速度は速度の時間微分であり、速度は位置の時間微分です。
高等学校で習う微分方程式は、下式で表されます。
\(f’\left( a\right) =\lim _{h\rightarrow 0}\dfrac{f\left( a+h\right) -f\left( a\right) }{h}\)
数値計算では極限を取れないため、\(h\)を極小の有限数として、下式(前進差分公式)で近似されます。
\(f’\left( a\right) =\dfrac{f\left( a+h\right) -f\left( a\right) }{h}\)
一方、上式よりも数値計算で使用されるのは、精度が高い下式(中心差分公式)です。
\(f’\left( a\right) =\dfrac{f\left( a+h\right) -\left( a-h\right) }{2h}\)
実装(中心差分公式)
上でご説明した中心差分公式を関数に定義して、実装してみます。
#input
def derivative(f,a,h):
    return(f(a+h)-f(a-h))/(2*h)
derivative()関数として、中心差分公式を定義しました。
ここに、無名関数ラムダを使用して、\(f\left( x\right) =x^{3}-1\)の\(x=1\)における微分係数を計算してみます。
\(h=0.00001\)とします。
A = derivative(lambda x:x**3-1,1,1e-5)
print(A)
#output
3.000000000097369誤差は少しありますが、高精度で計算されました。
mathモジュールを使用した、三角関数の微分結果を以下にご紹介します。
#input
def derivative(f,a,h):
    return(f(a+h)-f(a-h))/(2*h)

import math
A = derivative(math.cos,math.pi/6,1e-5)
print(A)
#output
-0.4999999999866222\(\left( \cos x\right)’=-\sin x\)ですので、真値は\(-0.5\)です。
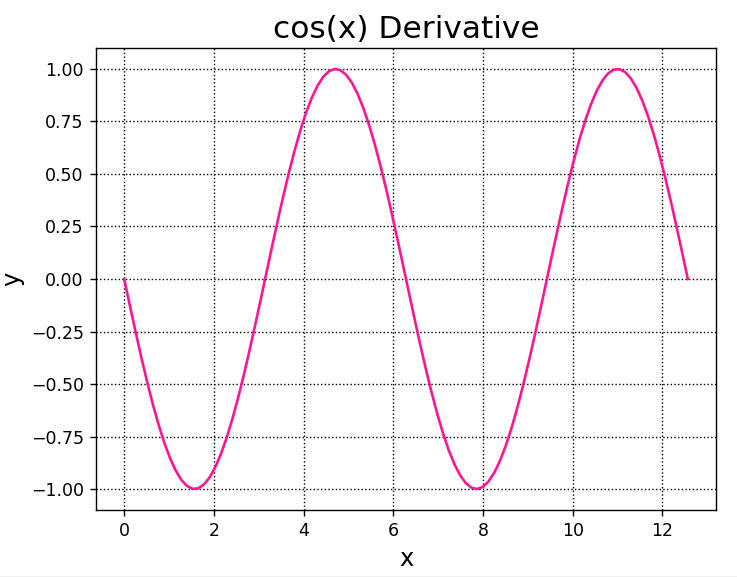
Matplotlibを使用して、微分係数をグラフにしてみます。
Numpyのnumpy.linspace()関数を使用することで、引数\(a\)に連続データを指定します。
#input
def derivative(f,a,h):
    return(f(a+h)-f(a-h))/(2*h)

import numpy as np
import matplotlib.pyplot as plt

fig = plt.figure()
A = fig.add_subplot(111)
A.grid(color="k",linestyle="dotted")
A.set_title("cos(x) Derivative",fontsize=18)
A.set_xlabel("x",fontsize=14)
A.set_ylabel("y",fontsize=14)

x = np.linspace(0,4*np.pi,100)
dfunc = derivative(np.cos,x,1e-5)

A.plot(x,dfunc,color="deeppink")
plt.show()
SciPy derivative()関数
Pythonの外部モジュールであるSciPyは、数値解析用のライブラリです。
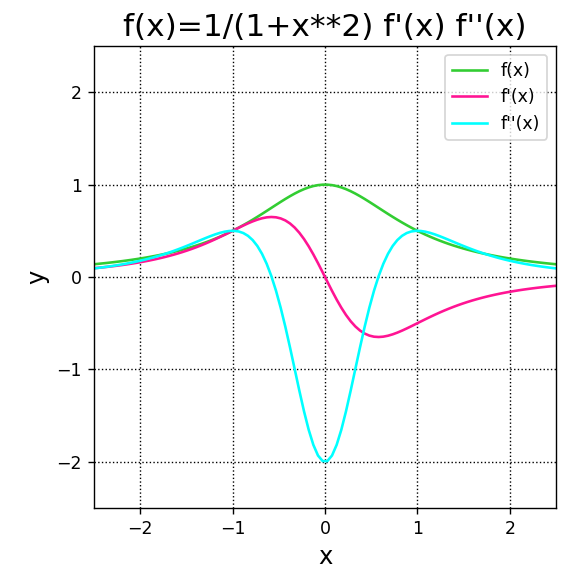
SciPyのderivative()関数は、指定した任意関数について、指定階数の微分関数を返す関数です。
SciPyで二次までの導関数を計算し、グラフに出力する例を以下に載せます。
#input
import numpy as np
import matplotlib.pyplot as plt

#  SciPyをインストールしていない場合、インストールする
#  python -m pip install --upgrade pip
#  pip install scipy
from scipy.misc import derivative

fig = plt.figure()
A = fig.add_subplot(111)
A.grid(color="k",linestyle="dotted")
A.set_title("f(x)=1/(1+x**2) f'(x) f''(x)",fontsize=18)
A.set_xlabel("x",fontsize=14)
A.set_ylabel("y",fontsize=14)

A.set_aspect("equal")
A.set_xlim(-2.5,2.5)
A.set_ylim(-2.5,2.5)

x = np.linspace(-2.5,2.5,100)
def func(x):
    return 1/(1+x**2)

dfunc1 = derivative(func,x,dx=1e-5)
dfunc2 = derivative(func,x,dx=1e-5,n=2)

A.plot(x,func(x),color="limegreen",label="f(x)")
A.plot(x,dfunc1,color="deeppink",label="f'(x)")
A.plot(x,dfunc2,color="aqua",label="f''(x)")
A.legend(fontsize=10)

plt.show()
SymPy diff()関数
Pythonの外部モジュールであるSymPyも、数学処理ライブラリです。
SymPyのdiff()関数を使用した導関数の出力例を以下にご紹介します。
#input
#  SymPyをインストールしていない場合、インストールする
#  python -m pip install --upgrade pip
#  pip install sympy
from sympy import *

x = symbols("x",real=True)
f1=x*cos(x)
f2=diff(f1,x)
f3=diff(f2,x)

print(f2)
print(f3)
#output
-x*sin(x) + cos(x)
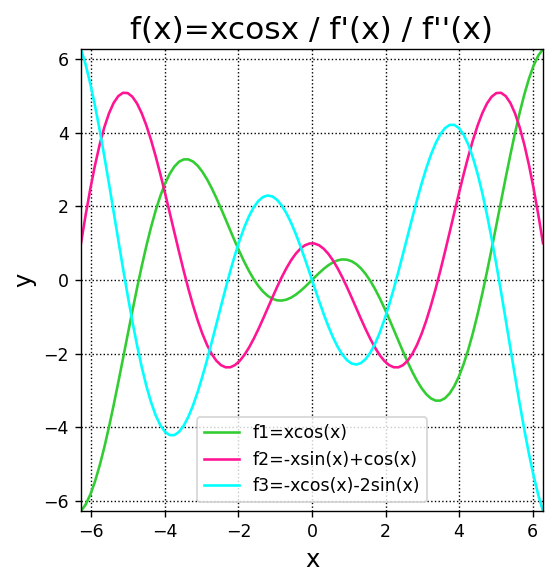
-x*cos(x) - 2*sin(x)出力された導関数をグラフに出力してみます。
#input
from math import cos, sin
import numpy as np
import matplotlib.pyplot as plt

fig = plt.figure()
A = fig.add_subplot(111)
A.grid(color="k",linestyle="dotted")
A.set_title("f(x)=xcosx / f'(x) / f''(x)",fontsize=18)
A.set_xlabel("x",fontsize=14)
A.set_ylabel("y",fontsize=14)

A.set_aspect("equal")
A.set_xlim(-2*np.pi,2*np.pi)
A.set_ylim(-2*np.pi,2*np.pi)

x = np.linspace(-2*np.pi,2*np.pi,100)
f1 = x*np.cos(x)
f2 = -x*np.sin(x) + np.cos(x)
f3 = -x*np.cos(x) - 2*np.sin(x)

A.plot(x,f1,color="limegreen",label="f1=xcos(x)")
A.plot(x,f2,color="deeppink",label="f2=-xsin(x)+cos(x)")
A.plot(x,f3,color="aqua",label="f3=-xcos(x)-2sin(x)")
A.legend(fontsize=10)

plt.show()
まとめ
この記事では、Python基礎となる数値微分について、ご説明しました。
本記事を参考に、ぜひ数値微分をマスターしてみてください。
参考
Python学習用おすすめ教材
Pythonの基本を学びたい方向け
統計学基礎を学びたい方向け
Pythonの統計解析を学びたい方向け
おすすめプログラミングスクール
Pythonをはじめ、プログラミングを学ぶなら、TechAcademy(テックアカデミー)がおすすめです。
私も入っていますが、好きな時間に気軽にオンラインで学べますので、何より楽しいです。
現役エンジニアからマンツーマンで学べるので、一人では中々続かない人にも、向いていると思います。
無料体験ができますので、まずは試してみてください!


