統計分析で使用される「ガウス関数」は、Pythonで実装・グラフ化することができます。
本記事では、Pythonを使用したガウス関数の実装とグラフ化方法について、詳しくご説明します。
- Python初心者の人
- Pythonによるガウス関数の実装とグラフ化方法について学びたい人
ガウス関数
ガウス関数(gaussian function)とは、データ平均\(\mu\)、データ分散\(\sigma ^{2}\)を用いて、下式で表される関数です。
\(f\left( x\right) =a\exp \left\{ -\dfrac{\left( x-\mu \right) ^{2}}{2\sigma ^{2}}\right\}\)
ガウス関数の実装
NumPyを使用した、ガウス関数の実装例を以下にご紹介します。
#input
import numpy as np

def gauss(x,a,mu,sigma):
    return a*np.exp(-(x-mu)**2 / (2*sigma**2))

x1 = gauss(0,1,0,1)
x2 = gauss(2,0.5,2,2)

print("gauss(0,1,0,1)=",x1)
print("gauss(2,0.5,2,2)=",x2)
#output
gauss(0,1,0,1)= 1.0
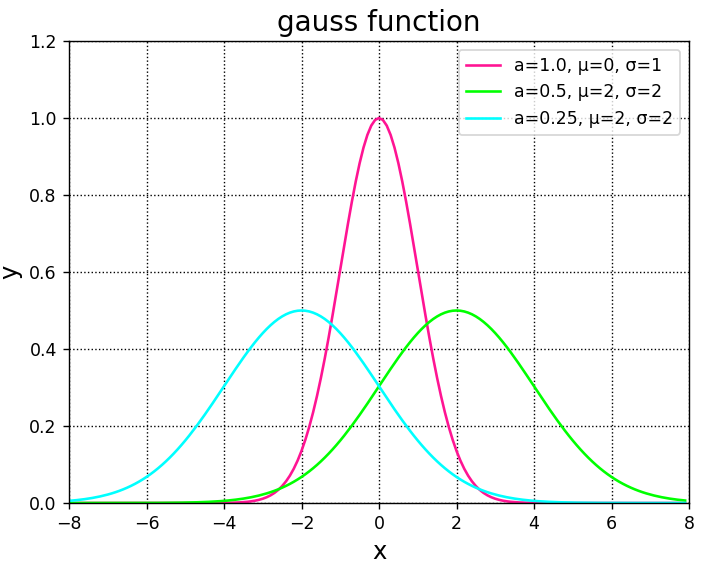
gauss(2,0.5,2,2)= 0.5実装した関数を使用した、ガウス関数のグラフ化例を以下にご紹介します。
#input
import numpy as np
import matplotlib.pyplot as plt

def gauss(x,a,mu,sigma):
    return a*np.exp(-(x-mu)**2 / (2*sigma**2))

fig = plt.figure()

A = fig.add_subplot(111)
A.grid(color="k",linestyle="dotted")
A.set_title("gauss function", fontsize = 16)
A.set_xlabel("x", fontsize = 14)
A.set_ylabel("y", fontsize = 14)

A.set_xlim([-8, 8])
A.set_ylim([0, 1.2])

x = np.arange(-8, 8, 0.1)

y1 = gauss(x,1,0,1)
y2 = gauss(x,0.5,2,2)
y3 = gauss(x,0.5,-2,2)

A.plot(x, y1, color="deeppink", label="a=1.0, μ=0, σ=1")
A.plot(x, y2, color="lime", label="a=0.5, μ=2, σ=2")
A.plot(x, y3, color="aqua", label="a=0.25, μ=2, σ=2")

A.legend()
plt.show()
正規分布
確率統計で多用される正規分布とは、下式で表される、ガウス関数を無限区間で積分した結果です。
\(N\left( \mu ,\sigma ^{2}\right) =\dfrac{1}{\sqrt{2\pi \sigma }}\exp \left\{ -\dfrac{\left( x-\mu \right) ^{2}}{2\sigma ^{2}}\right\}\)
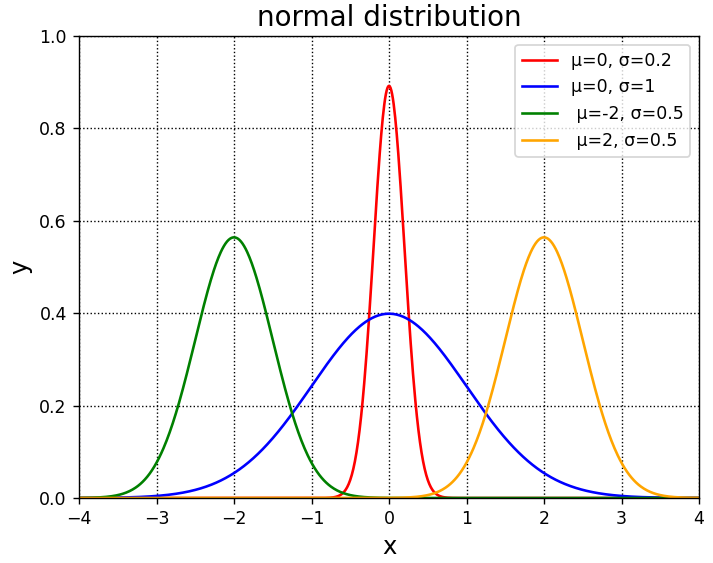
正規分布の実装とグラフ化例を以下にご紹介します。
#input
import numpy as np
import matplotlib.pyplot as plt

def N(x,mu,sigma):
    return (1/np.sqrt(2*np.pi*sigma))*np.exp(-(x-mu)**2 / (2*sigma**2))

fig = plt.figure()

A = fig.add_subplot(111)
A.grid(color="k",linestyle="dotted")
A.set_title("normal distribution", fontsize = 16)
A.set_xlabel("x", fontsize = 14)
A.set_ylabel("y", fontsize = 14)

A.set_xlim([-4, 4])
A.set_ylim([0, 1])

x = np.arange(-4, 4, 0.01)

y1 = N(x,0,0.2)
y2 = N(x,0,1)
y3 = N(x,-2,0.5)
y4 = N(x,2,0.5)

A.plot(x, y1, color="red", label="μ=0, σ=0.2")
A.plot(x, y2, color="blue", label="μ=0, σ=1")
A.plot(x, y3, color="green", label=" μ=-2, σ=0.5")
A.plot(x, y4, color="orange", label=" μ=2, σ=0.5")

A.legend()
plt.show()
まとめ
この記事では、Pythonを使用したガウス関数の実装とグラフ化方法について、ご説明しました。
本記事を参考に、ぜひ試してみて下さい。
参考
Python学習用おすすめ教材
Pythonの基本を学びたい方向け
統計学基礎を学びたい方向け
Pythonの統計解析を学びたい方向け
おすすめプログラミングスクール
Pythonをはじめ、プログラミングを学ぶなら、TechAcademy(テックアカデミー)がおすすめです。
私も入っていますが、好きな時間に気軽にオンラインで学べますので、何より楽しいです。
現役エンジニアからマンツーマンで学べるので、一人では中々続かない人にも、向いていると思います。
無料体験ができますので、まずは試してみてください!


