スポンサーリンク
ベクトルの拡大と縮小は、拡大行列を使用して、Pythonで簡単に表現することができます。
本記事では、Pythonを使用した拡大行列の使用方法について、詳しくご説明します。
こんな人に読んでほしい
- Python初心者の人
- Pythonを使用した拡大行列の使用方法について学びたい人
拡大行列
拡大行列(augmented matrix)とは、対角成分に拡大率が並び、それ以外が0となるような正方行列のことです。
ベクトルの拡大と縮小
拡大行列を使用した、ベクトルの拡大と縮小の例をご紹介します。
#input
import numpy as np
v = np.array([8,8])
a = 2 * np.eye(2,dtype = int)
b = 0.5 * np.eye(2,dtype = int)
print("拡大行列a:\n{}".format(a))
print("拡大行列b:\n{}".format(b))
print("2倍に拡大:\n{}".format(np.dot(a,v)))
print("1/2に縮小:\n{}".format(np.dot(b,v)))
#output
拡大行列a:
[[2 0]
[0 2]]
拡大行列b:
[[0.5 0. ]
[0. 0.5]]
2倍に拡大:
[16 16]
1/2に縮小:
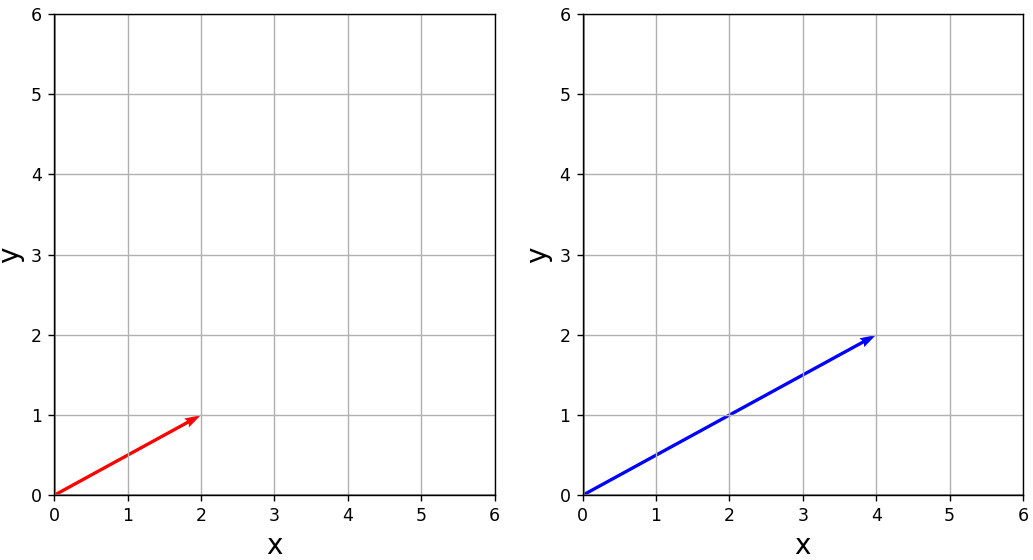
[4. 4.]Matplotlibを使用して、拡大の様子を可視化してみます。
#input
import numpy as np
import matplotlib.pyplot as plt

def coordinate(axes, range_x, range_y, grid = True,
               xyline = True, xlabel = "x", ylabel = "y"):
    axes.set_xlabel(xlabel, fontsize = 16)
    axes.set_ylabel(ylabel, fontsize = 16)
    axes.set_xlim(range_x[0], range_x[1])
    axes.set_ylim(range_y[0], range_y[1])
    if grid == True:
        axes.grid()
    if xyline == True:
        axes.axhline(0, color = "gray")
        axes.axvline(0, color = "gray")

def vector(axes, loc, vector, color = "red"):
    axes.quiver(loc[0], loc[1],
              vector[0], vector[1], color = color,
              angles = 'xy', scale_units = 'xy', scale = 1)

fig, ax = plt.subplots(1, 2, figsize=(10, 5))

# 座標を準備
coordinate(ax[0], [0, 6], [0, 6])
coordinate(ax[1], [0, 6], [0, 6])

# 拡大行列 a を定義
a = 2 * np.eye(2, dtype = int)

# ベクトル始点
loc = np.array([0, 0])

# ベクトルv1
v1 = np.array([2, 1])

# ベクトルv1を拡大行列aで拡大
v2 = np.dot(a, v1)

vector(ax[0], loc, v1, color = "red")
vector(ax[1], loc, v2, color = "blue")

plt.show()
領域の拡大と縮小
拡大行列を使用した、領域の拡大と縮小の例をご紹介します。
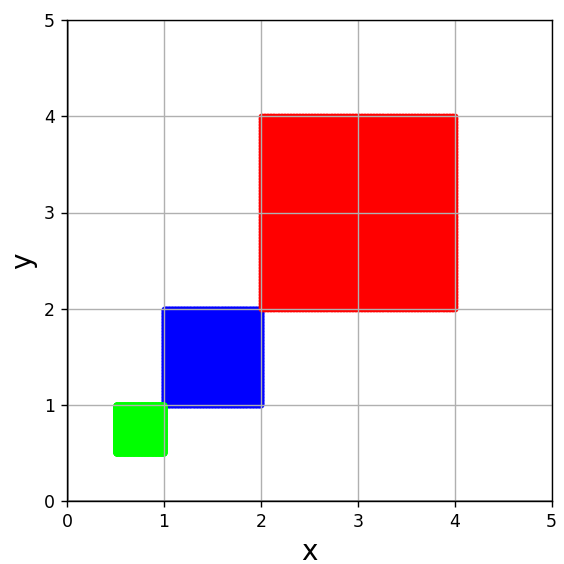
Matplotlibで生成した格子領域について、拡大行列を使用して、拡大・縮小の様子を可視化してみます。
#input
import numpy as np
import matplotlib.pyplot as plt

def coordinate(axes, range_x, range_y, grid = True,
               xyline = True, xlabel = "x", ylabel = "y"):
    axes.set_xlabel(xlabel, fontsize = 16)
    axes.set_ylabel(ylabel, fontsize = 16)
    axes.set_xlim(range_x[0], range_x[1])
    axes.set_ylim(range_y[0], range_y[1])
    if grid == True:
        axes.grid()
    if xyline == True:
        axes.axhline(0, color = "gray")
        axes.axvline(0, color = "gray")

fig, ax = plt.subplots(1, 1, figsize=(5, 5))

# 座標を準備
coordinate(ax, [0, 5], [0, 5])

# 拡大行列 a と b を定義
a = 2 * np.eye(2, dtype = int)
b = 0.5 * np.eye(2, dtype = int)

# 格子領域の生成
x = np.linspace(1, 2, 129)
y = np.linspace(1, 2, 129)
X, Y = np.meshgrid(x, y)

# XとYをベクトルに変換
X = X.reshape(-1)
Y = Y.reshape(-1)

# XとYを縦に連結してベクトルが横に並ぶ行列を作成
s0 = np.vstack((X, Y))

# 領域s0を拡大行列a, bで変換
s1 = np.dot(a, s0)
s2 = np.dot(b, s0)

# s0, s1, s2の表示
ax.scatter(s0[0], s0[1], s = 5, color = "blue")
ax.scatter(s1[0], s1[1], s = 5, color = "red")
ax.scatter(s2[0], s2[1], s = 5, color = "lime")

plt.show()
まとめ
この記事では、Pythonを使用した拡大行列の使用方法について、ご説明しました。
本記事を参考に、ぜひ試してみて下さい。
参考
Python学習用おすすめ教材
Pythonの基本を学びたい方向け
リンク
統計学基礎を学びたい方向け
リンク
Pythonの統計解析を学びたい方向け
リンク
おすすめプログラミングスクール
Pythonをはじめ、プログラミングを学ぶなら、TechAcademy(テックアカデミー)がおすすめです。
私も入っていますが、好きな時間に気軽にオンラインで学べますので、何より楽しいです。
現役エンジニアからマンツーマンで学べるので、一人では中々続かない人にも、向いていると思います。
無料体験ができますので、まずは試してみてください!
\まずは無料体験!/
スポンサーリンク


